plot helpers
The plotting examples use the kenya dataset shipped with
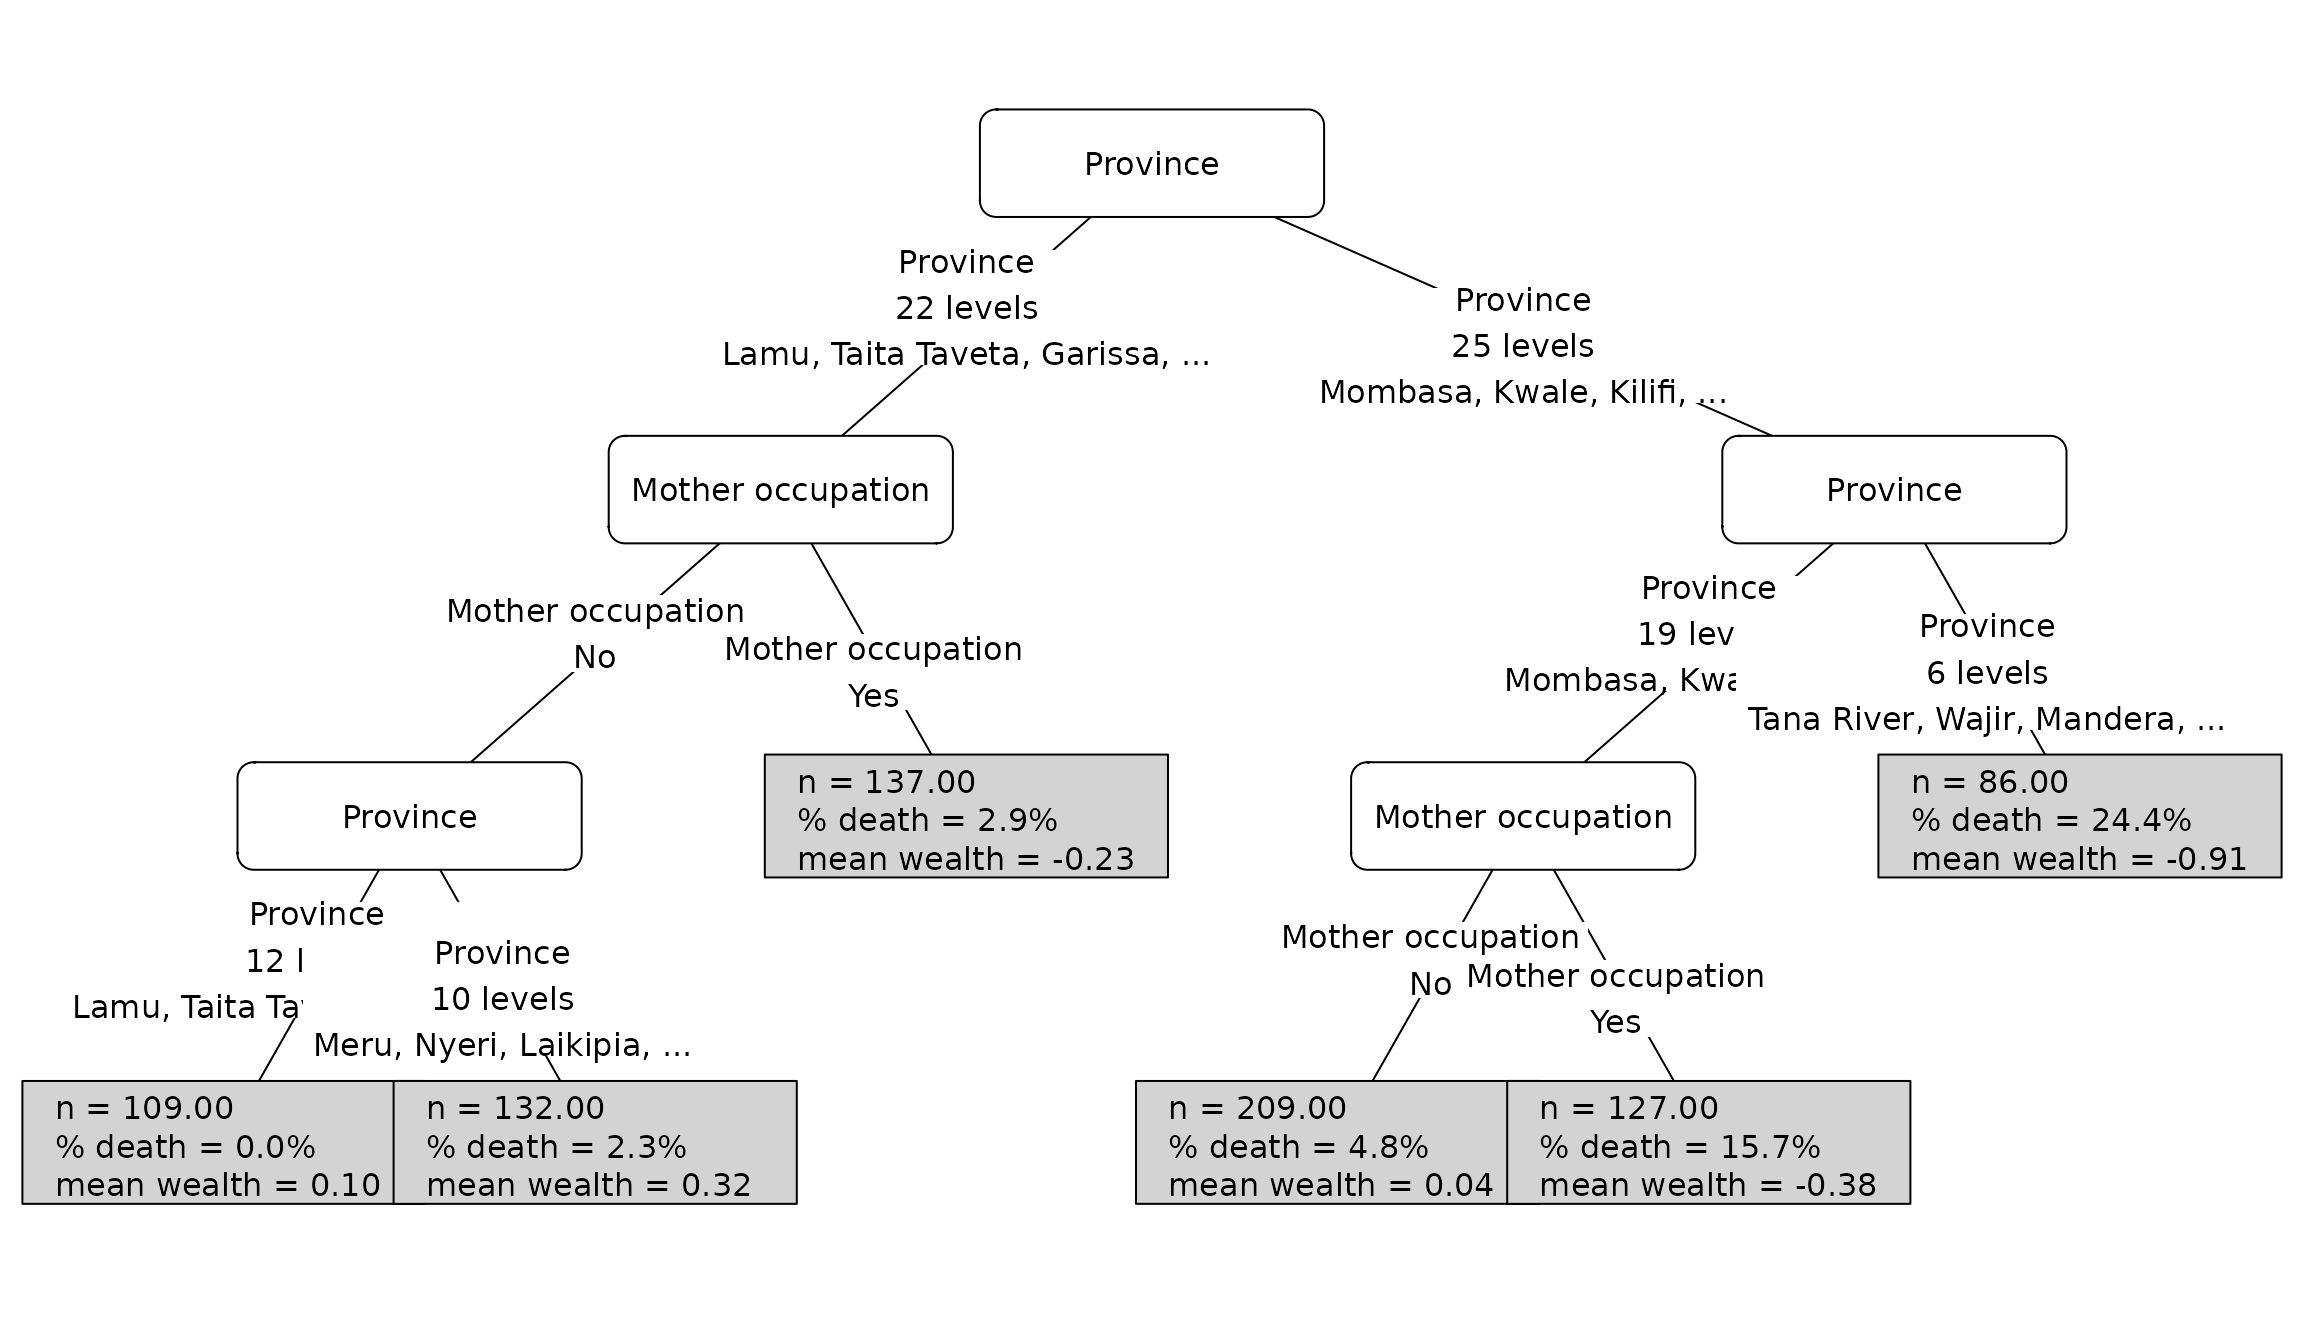
the package. The tree partitions under-five death by socioeconomic rank
(wealth) and a small set of interpretable predictors, so
the examples show the kind of labels and terminal-node summaries used in
an actual analysis.
data(kenya, package = "ineqTrees")

kenya_plot_vars <- c(
  "wealth",
  "deadu5_num",
  "rural",
  "ed",
  "reg",
  "unskilled"
)

kenya_plot_data <- kenya[
  stats::complete.cases(kenya[, kenya_plot_vars]),
  kenya_plot_vars
]

set.seed(20260512)
kenya_plot_data <- kenya_plot_data[
  sample.int(nrow(kenya_plot_data), 800L),
  ,
  drop = FALSE
]

kenya_plot_fit <- ci_tree(
  formula = cbind(wealth, deadu5_num) ~ rural + ed + reg + unskilled,
  data = kenya_plot_data,
  rank_name = "wealth",
  outcome_name = "deadu5_num",
  control = ci_tree_control(
    minsplit = 100,
    minbucket = 50,
    minprob = 0.05,
    maxdepth = 3
  )
)

kenya_var_labels <- c(
  rural = "Residence",
  ed = "Mother education",
  reg = "Province",
  unskilled = "Mother occupation"
)

kenya_stat_funs <- list(
  n = nrow,
  mortality = function(df) mean(df$deadu5_num),
  mean_wealth = function(df) mean(df$wealth)
)
tree_compact_split_label("wealth_index", "lowest")
#> [1] "wealth index\nlowest"

tree_compact_split_label(
  "water_source",
  "piped, borehole, well, river",
  var_labels = c(water_source = "Water source"),
  plural_overrides = c("Water source" = "sources")
)
#> [1] "Water source\n4 sources\npiped, borehole, well,\n..."
data(kenya, package = "ineqTrees")
kenya_plot_vars <- c("wealth", "deadu5_num", "rural", "ed", "reg", "unskilled")
kenya_plot_data <- kenya[
  stats::complete.cases(kenya[, kenya_plot_vars]),
  kenya_plot_vars
]
set.seed(20260512)
kenya_plot_data <- kenya_plot_data[
  sample.int(nrow(kenya_plot_data), 800L),
  ,
  drop = FALSE
]
kenya_plot_fit <- ci_tree(
  cbind(wealth, deadu5_num) ~ rural + ed + reg + unskilled,
  data = kenya_plot_data,
  rank_name = "wealth",
  outcome_name = "deadu5_num",
  control = ci_tree_control(
    minsplit = 100,
    minbucket = 50,
    minprob = 0.05,
    maxdepth = 3
  )
)
kenya_var_labels <- c(
  rural = "Residence",
  ed = "Mother education",
  reg = "Province",
  unskilled = "Mother occupation"
)

inherits(tree_edge_panel_compact, "grapcon_generator")
#> [1] TRUE
is.function(tree_edge_panel_compact(
  kenya_plot_fit,
  var_labels = kenya_var_labels,
  plural_overrides = c(Province = "provinces")
))
#> [1] TRUE
data(kenya, package = "ineqTrees")
kenya_plot_vars <- c("wealth", "deadu5_num", "rural", "ed", "reg", "unskilled")
kenya_plot_data <- kenya[
  stats::complete.cases(kenya[, kenya_plot_vars]),
  kenya_plot_vars
]
set.seed(20260512)
kenya_plot_data <- kenya_plot_data[
  sample.int(nrow(kenya_plot_data), 800L),
  ,
  drop = FALSE
]
kenya_plot_fit <- ci_tree(
  cbind(wealth, deadu5_num) ~ rural + ed + reg + unskilled,
  data = kenya_plot_data,
  rank_name = "wealth",
  outcome_name = "deadu5_num",
  control = ci_tree_control(
    minsplit = 100,
    minbucket = 50,
    minprob = 0.05,
    maxdepth = 3
  )
)
kenya_var_labels <- c(
  rural = "Residence",
  ed = "Mother education",
  reg = "Province",
  unskilled = "Mother occupation"
)

inherits(tree_inner_panel_labeled, "grapcon_generator")
#> [1] TRUE
is.function(tree_inner_panel_labeled(
  kenya_plot_fit,
  var_labels = kenya_var_labels
))
#> [1] TRUE
data(kenya, package = "ineqTrees")
kenya_plot_vars <- c("wealth", "deadu5_num", "rural", "ed", "reg", "unskilled")
kenya_plot_data <- kenya[
  stats::complete.cases(kenya[, kenya_plot_vars]),
  kenya_plot_vars
]
set.seed(20260512)
kenya_plot_data <- kenya_plot_data[
  sample.int(nrow(kenya_plot_data), 800L),
  ,
  drop = FALSE
]
kenya_plot_fit <- ci_tree(
  cbind(wealth, deadu5_num) ~ rural + ed + reg + unskilled,
  data = kenya_plot_data,
  rank_name = "wealth",
  outcome_name = "deadu5_num",
  control = ci_tree_control(
    minsplit = 100,
    minbucket = 50,
    minprob = 0.05,
    maxdepth = 3
  )
)
kenya_stat_funs <- list(
  n = nrow,
  mortality = function(df) mean(df$deadu5_num),
  mean_wealth = function(df) mean(df$wealth)
)

tree_build_terminal_stats(
  kenya_plot_fit,
  kenya_plot_data,
  stat_funs = kenya_stat_funs
)
#>   node_id   n  mortality mean_wealth
#> 1       4 109 0.00000000  0.10045582
#> 2       5 132 0.02272727  0.31801860
#> 3       6 137 0.02919708 -0.23154495
#> 4       9 209 0.04784689  0.04196376
#> 5      10 127 0.15748031 -0.38363010
#> 6      11  86 0.24418605 -0.90504013
data(kenya, package = "ineqTrees")
kenya_plot_vars <- c("wealth", "deadu5_num", "rural", "ed", "reg", "unskilled")
kenya_plot_data <- kenya[
  stats::complete.cases(kenya[, kenya_plot_vars]),
  kenya_plot_vars
]
set.seed(20260512)
kenya_plot_data <- kenya_plot_data[
  sample.int(nrow(kenya_plot_data), 800L),
  ,
  drop = FALSE
]
kenya_plot_fit <- ci_tree(
  cbind(wealth, deadu5_num) ~ rural + ed + reg + unskilled,
  data = kenya_plot_data,
  rank_name = "wealth",
  outcome_name = "deadu5_num",
  control = ci_tree_control(
    minsplit = 100,
    minbucket = 50,
    minprob = 0.05,
    maxdepth = 3
  )
)
kenya_stat_funs <- list(
  n = nrow,
  mortality = function(df) mean(df$deadu5_num),
  mean_wealth = function(df) mean(df$wealth)
)

stats_df <- tree_build_terminal_stats(
  kenya_plot_fit,
  kenya_plot_data,
  stat_funs = kenya_stat_funs
)

inherits(tree_terminal_panel_stats, "grapcon_generator")
#> [1] TRUE
is.function(tree_terminal_panel_stats(
  kenya_plot_fit,
  stats_df,
  stat_labels = c(
    n = "n",
    mortality = "% death",
    mean_wealth = "mean wealth"
  ),
  stat_formatters = list(
    mortality = function(x) sprintf("%.1f%%", 100 * x),
    mean_wealth = function(x) sprintf("%.2f", x)
  )
))
#> [1] TRUE
data(kenya, package = "ineqTrees")
kenya_plot_vars <- c("wealth", "deadu5_num", "rural", "ed", "reg", "unskilled")
kenya_plot_data <- kenya[
  stats::complete.cases(kenya[, kenya_plot_vars]),
  kenya_plot_vars
]
set.seed(20260512)
kenya_plot_data <- kenya_plot_data[
  sample.int(nrow(kenya_plot_data), 800L),
  ,
  drop = FALSE
]
kenya_plot_fit <- ci_tree(
  cbind(wealth, deadu5_num) ~ rural + ed + reg + unskilled,
  data = kenya_plot_data,
  rank_name = "wealth",
  outcome_name = "deadu5_num",
  control = ci_tree_control(
    minsplit = 100,
    minbucket = 50,
    minprob = 0.05,
    maxdepth = 3
  )
)
kenya_var_labels <- c(
  rural = "Residence",
  ed = "Mother education",
  reg = "Province",
  unskilled = "Mother occupation"
)
kenya_stat_funs <- list(
  n = nrow,
  mortality = function(df) mean(df$deadu5_num),
  mean_wealth = function(df) mean(df$wealth)
)

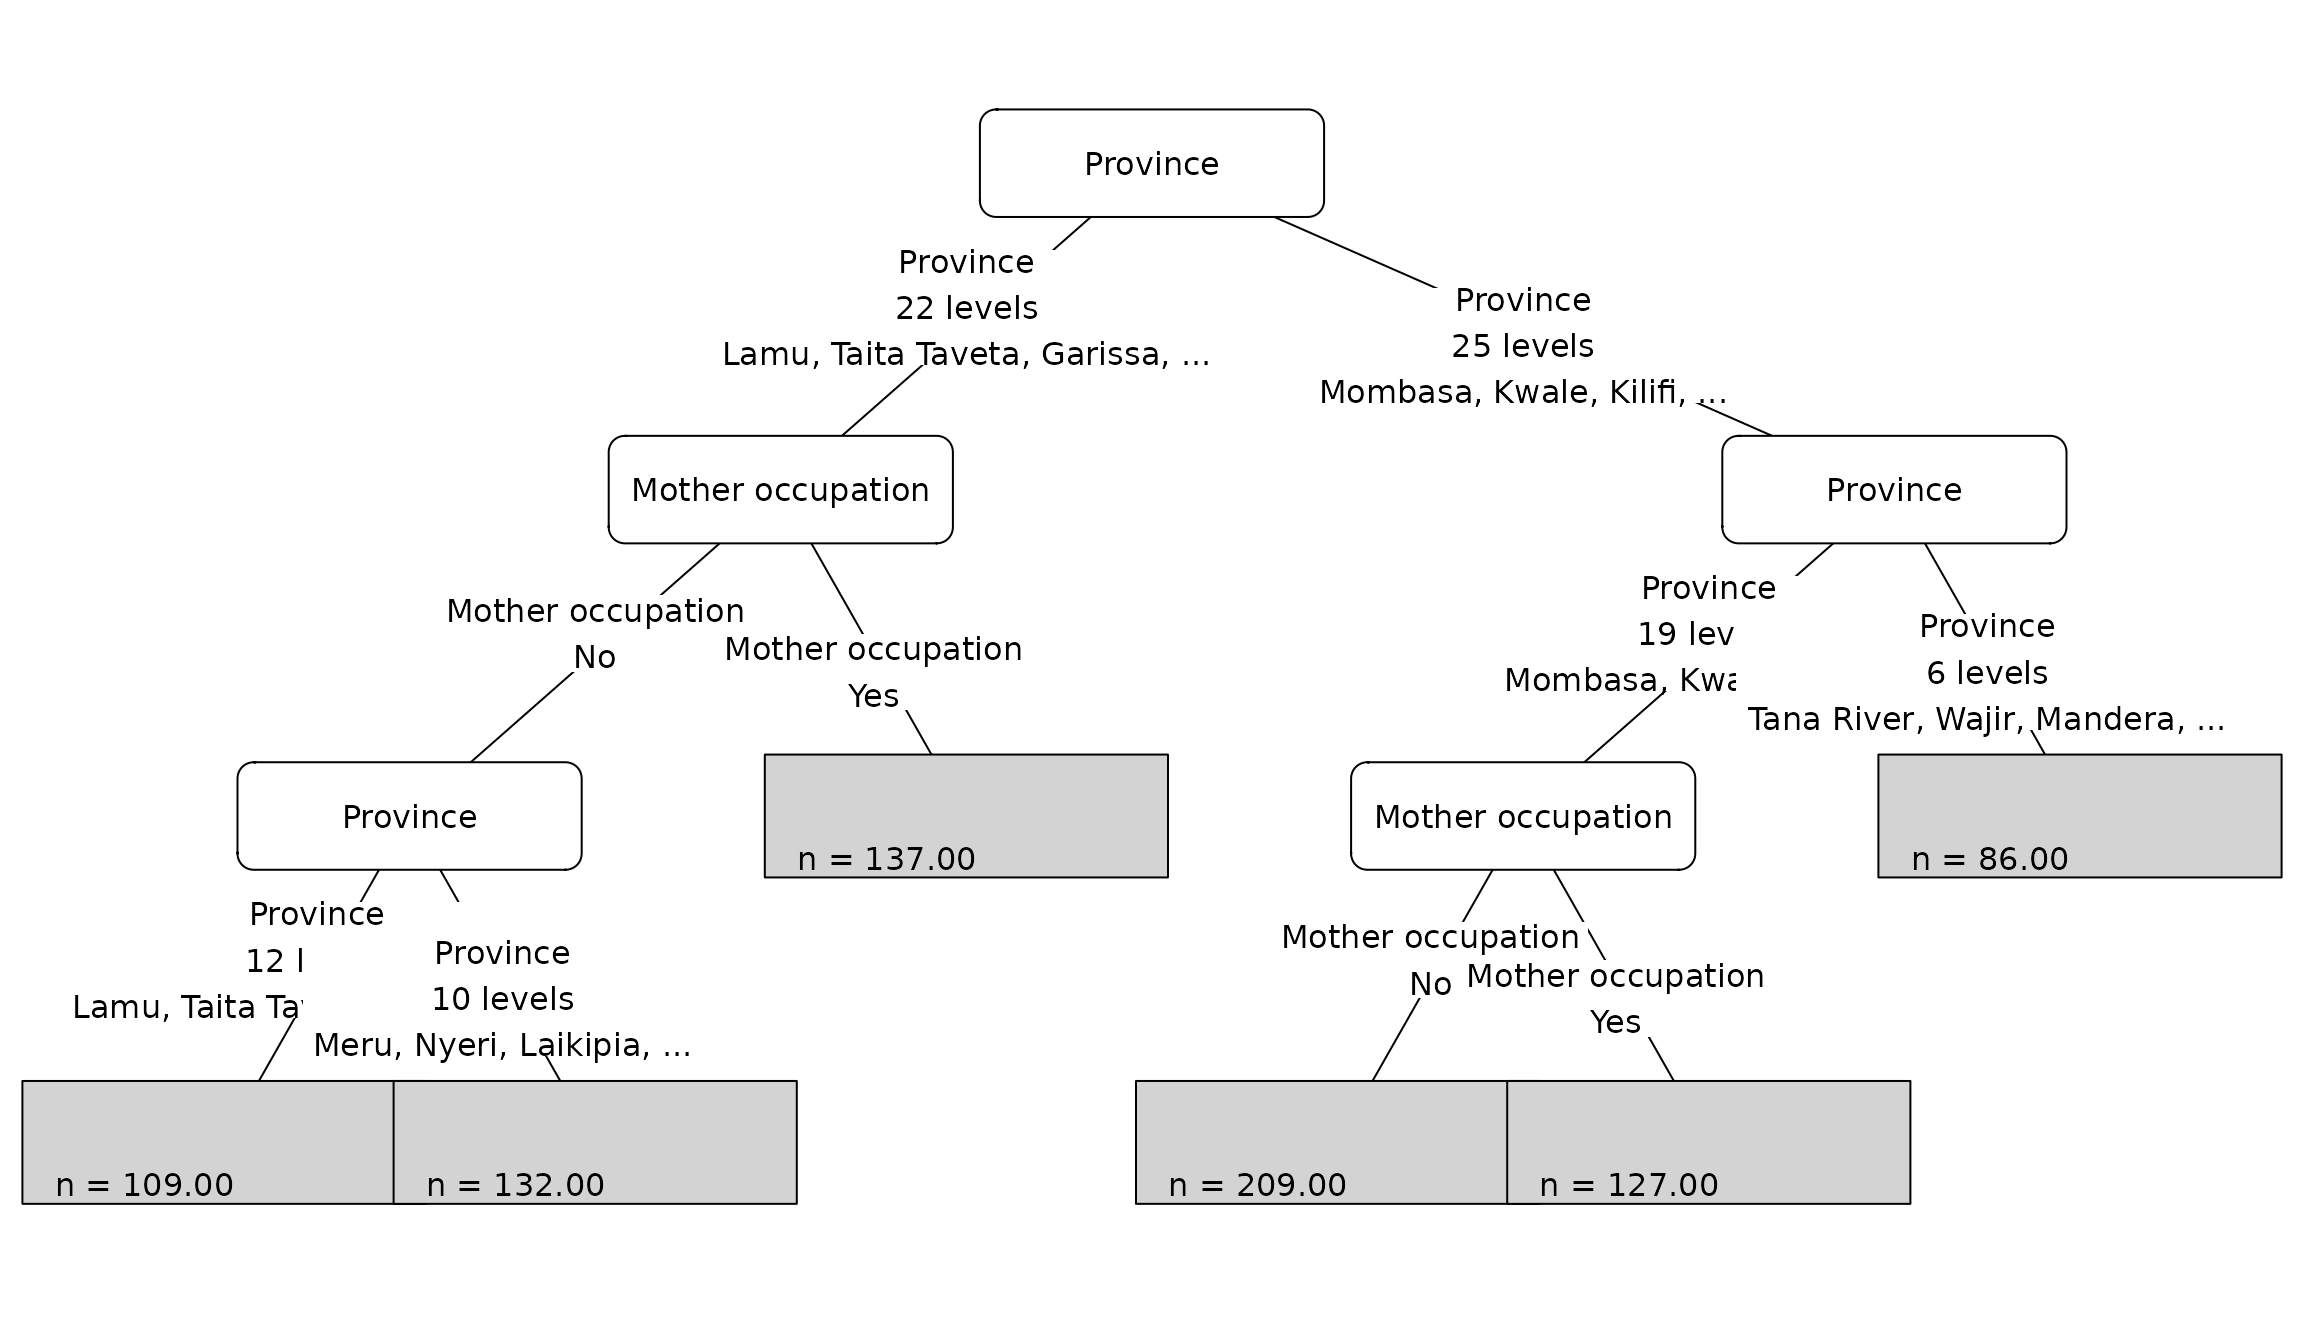
plot(
  kenya_plot_fit,
  var_labels = kenya_var_labels,
  plural_overrides = c(Province = "provinces")
)
plot(
  kenya_plot_fit,
  data = kenya_plot_data,
  var_labels = kenya_var_labels,
  plural_overrides = c(Province = "provinces"),
  terminal_stats = kenya_stat_funs,
  stat_labels = c(
    n = "n",
    mortality = "% death",
    mean_wealth = "mean wealth"
  ),
  stat_formatters = list(
    mortality = function(x) sprintf("%.1f%%", 100 * x),
    mean_wealth = function(x) sprintf("%.2f", x)
  )
)