Plot a greedy concentration-index tree with labeled split and node panels
Source:R/tree_default_name.R
plot.ci_tree.Rdci_tree() returns objects with class ci_tree, so calling plot() on a
fitted tree dispatches to this method. The method keeps the underlying
partykit layout while supplying compact edge labels, labeled internal
nodes, and optional terminal-node summaries by default.
Usage
# S3 method for class 'ci_tree'
plot(
  x,
  main = NULL,
  terminal_panel = NULL,
  tp_args = list(),
  inner_panel = NULL,
  ip_args = list(),
  edge_panel = NULL,
  ep_args = list(),
  data = NULL,
  terminal_stats = list(n = function(data) NROW(data)),
  var_labels = NULL,
  stat_labels = NULL,
  stat_formatters = list(),
  plural_overrides = NULL,
  show_p = TRUE,
  edge_fill = "white",
  inner_fill = "white",
  terminal_fill = "lightgray",
  ...
)
Arguments
- x
A fitted
ci_treeobject created byci_tree().- main
Optional main title passed to the underlying plot method.
- terminal_panel, inner_panel, edge_panel
Optional panel functions passed through to
partykitplotting.- tp_args, ip_args, ep_args
Lists of extra arguments for the panel generators.
- data
Optional data used to compute terminal-node summaries. Defaults to the model frame stored on
x.- terminal_stats
Named list of summary functions for terminal nodes. Use
NULLto fall back to the defaultpartykitterminal panel.- var_labels
Optional named character vector mapping variable names to prettier labels in split and inner-node annotations.
- stat_labels
Optional named character vector for terminal summary labels.
- stat_formatters
Optional named list of formatting functions for terminal summaries.
- plural_overrides
Optional named character vector giving custom plural nouns for summarized factor-level groups in edge labels. Passed to the default edge panel and ignored when a custom
edge_panelis supplied.- show_p
Logical; include split-test p-values in internal nodes.
- edge_fill, inner_fill, terminal_fill
Fill colors for the custom panels.
- ...
Additional arguments passed to
partykit::plot.party().
Examples
data(kenya, package = "ineqTrees")
kenya_plot_vars <- c("wealth", "deadu5_num", "rural", "ed", "reg", "unskilled")
kenya_plot_data <- kenya[
stats::complete.cases(kenya[, kenya_plot_vars]),
kenya_plot_vars
]
set.seed(20260512)
kenya_plot_data <- kenya_plot_data[
sample.int(nrow(kenya_plot_data), 800L),
,
drop = FALSE
]
kenya_plot_fit <- ci_tree(
cbind(wealth, deadu5_num) ~ rural + ed + reg + unskilled,
data = kenya_plot_data,
rank_name = "wealth",
outcome_name = "deadu5_num",
control = ci_tree_control(
minsplit = 100,
minbucket = 50,
minprob = 0.05,
maxdepth = 3
)
)
kenya_var_labels <- c(
rural = "Residence",
ed = "Mother education",
reg = "Province",
unskilled = "Mother occupation"
)
kenya_stat_funs <- list(
n = nrow,
mortality = function(df) mean(df$deadu5_num),
mean_wealth = function(df) mean(df$wealth)
)
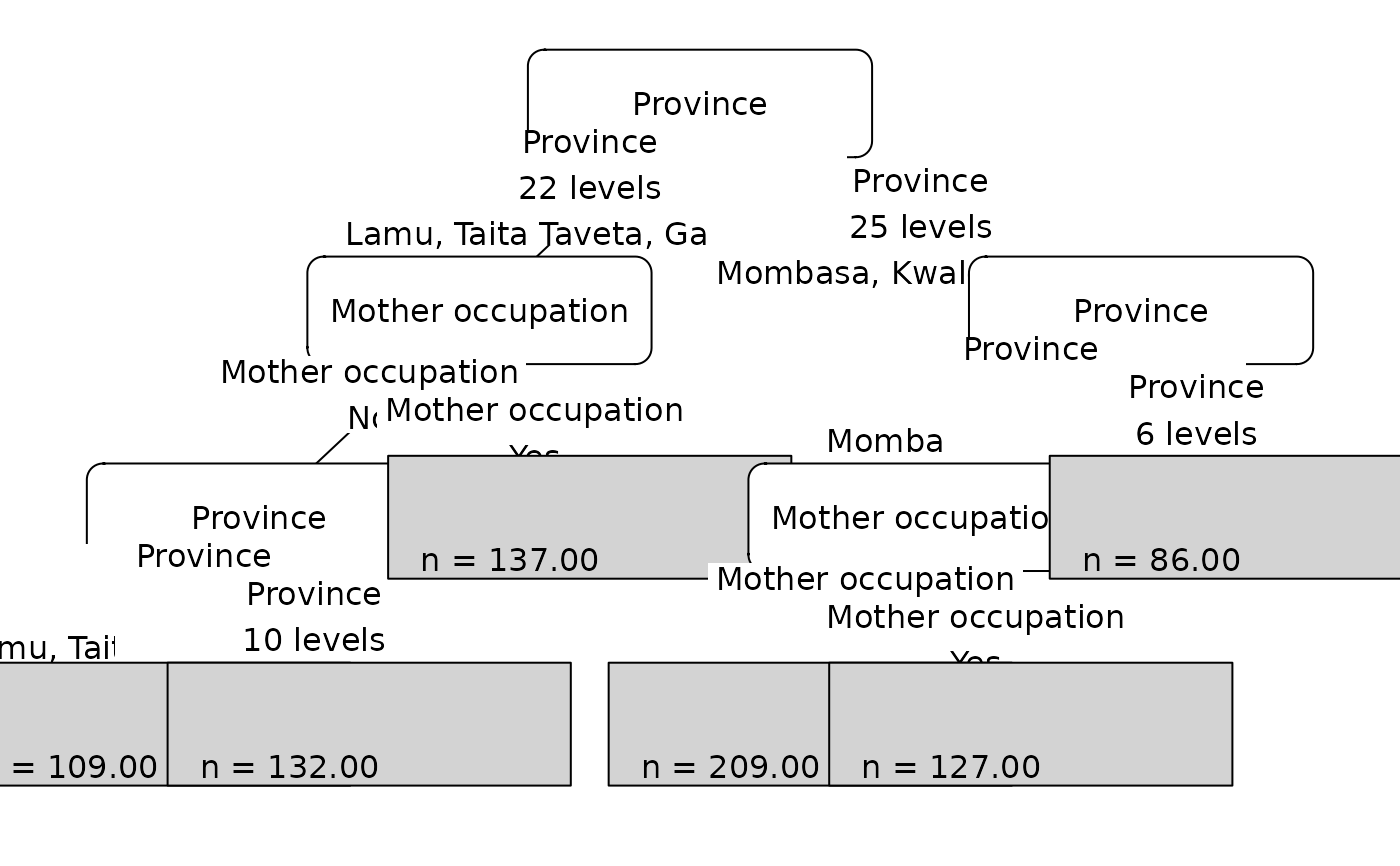
plot(
kenya_plot_fit,
var_labels = kenya_var_labels,
plural_overrides = c(Province = "provinces")
)
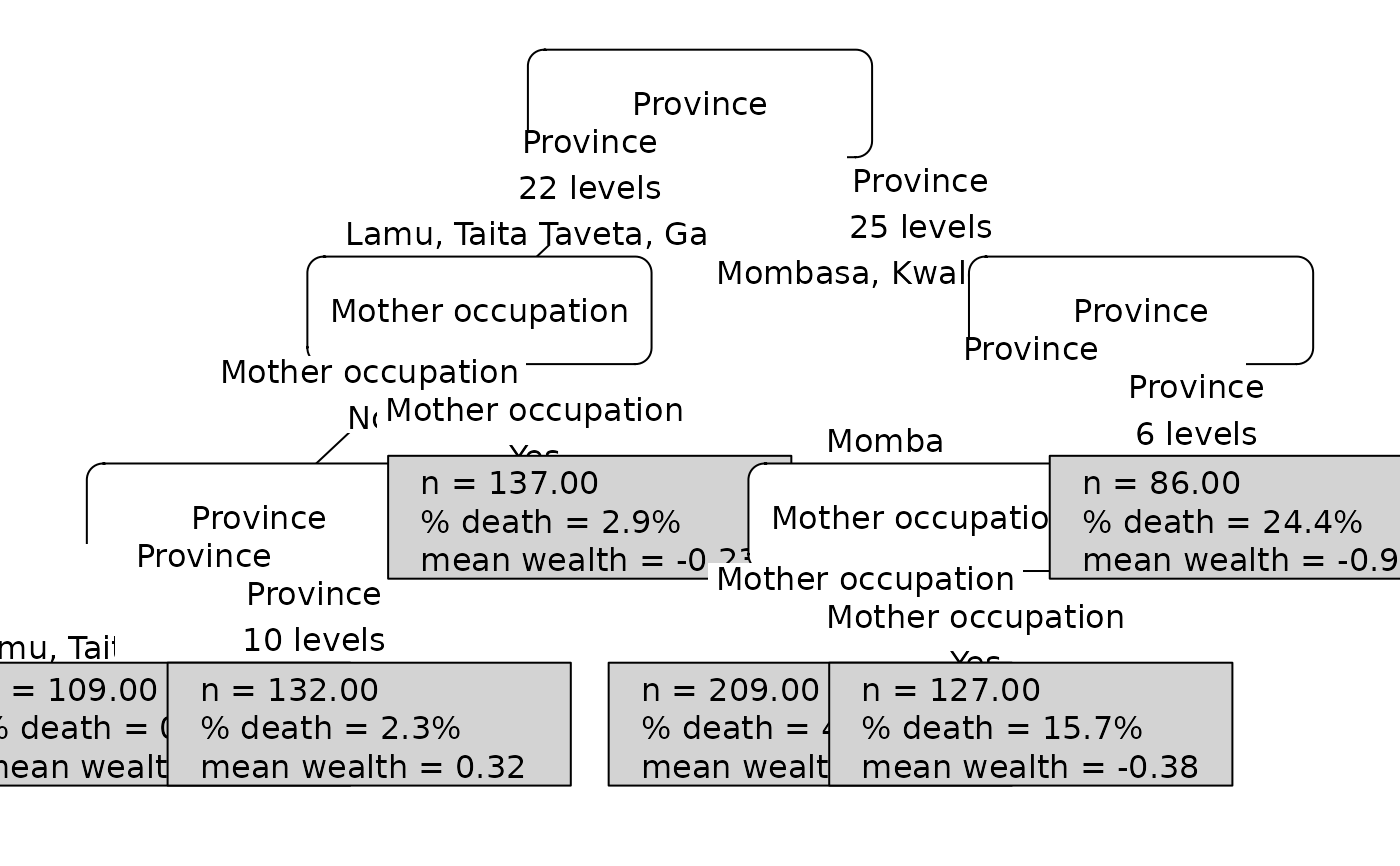
 plot(
kenya_plot_fit,
data = kenya_plot_data,
var_labels = kenya_var_labels,
plural_overrides = c(Province = "provinces"),
terminal_stats = kenya_stat_funs,
stat_labels = c(
n = "n",
mortality = "% death",
mean_wealth = "mean wealth"
),
stat_formatters = list(
mortality = function(x) sprintf("%.1f%%", 100 * x),
mean_wealth = function(x) sprintf("%.2f", x)
)
)
plot(
kenya_plot_fit,
data = kenya_plot_data,
var_labels = kenya_var_labels,
plural_overrides = c(Province = "provinces"),
terminal_stats = kenya_stat_funs,
stat_labels = c(
n = "n",
mortality = "% death",
mean_wealth = "mean wealth"
),
stat_formatters = list(
mortality = function(x) sprintf("%.1f%%", 100 * x),
mean_wealth = function(x) sprintf("%.2f", x)
)
)