Survival Analysis R

Published

May 13, 2023

What is Survival Analysis?

Introducing the GBSG2 dataset

In this course, we will frequently use the GBSG2 dataset. This dataset contains information on breast cancer patients and their survival. In this exercise, we will take a first look at it in R.

The TH.data package is loaded for you in this exercise.

# Check out the help page for this dataset
help(GBSG2, package = "TH.data")
# Load the data
data(GBSG2, package = "TH.data")

# Look at the summary of the dataset
summary(GBSG2)
 horTh          age        menostat       tsize        tgrade   
 no :440   Min.   :21.00   Pre :290   Min.   :  3.00   I  : 81  
 yes:246   1st Qu.:46.00   Post:396   1st Qu.: 20.00   II :444  
           Median :53.00              Median : 25.00   III:161  
           Mean   :53.05              Mean   : 29.33            
           3rd Qu.:61.00              3rd Qu.: 35.00            
           Max.   :80.00              Max.   :120.00            
     pnodes         progrec           estrec             time       
 Min.   : 1.00   Min.   :   0.0   Min.   :   0.00   Min.   :   8.0  
 1st Qu.: 1.00   1st Qu.:   7.0   1st Qu.:   8.00   1st Qu.: 567.8  
 Median : 3.00   Median :  32.5   Median :  36.00   Median :1084.0  
 Mean   : 5.01   Mean   : 110.0   Mean   :  96.25   Mean   :1124.5  
 3rd Qu.: 7.00   3rd Qu.: 131.8   3rd Qu.: 114.00   3rd Qu.:1684.8  
 Max.   :51.00   Max.   :2380.0   Max.   :1144.00   Max.   :2659.0  
      cens       
 Min.   :0.0000  
 1st Qu.:0.0000  
 Median :0.0000  
 Mean   :0.4359  
 3rd Qu.:1.0000  
 Max.   :1.0000  

Digging into the GBSG2 dataset 1

In the previous exercise, we learned about the GBSG2 dataset. Let’s dig a bit deeper into it to understand the variables we will use in the following.

The cens variable contains values that indicate whether or not a person in the study has died. In this exercise, you’ll explore these censored values.

# Count censored and uncensored data
num_cens <- table(GBSG2$cens)
num_cens

  0   1 
387 299 
# Create barplot of censored and uncensored data
barplot(num_cens)

Using the Surv() function for GBSG2

In the video, we learned about the Surv() function, which generates a Surv object. Let’s look a little deeper into what a Surv object actually is. We will use the GBSG2 data again.

The survival package and GBSG2 data are loaded for you in this exercise.

# Create Surv-Object
sobj <- Surv( GBSG2$time, GBSG2$cens)

# Look at 10 first elements
sobj[1:10]
 [1] 1814  2018   712  1807   772   448  2172+ 2161+  471  2014+
# Look at summary
summary(sobj)
      time            status      
 Min.   :   8.0   Min.   :0.0000  
 1st Qu.: 567.8   1st Qu.:0.0000  
 Median :1084.0   Median :0.0000  
 Mean   :1124.5   Mean   :0.4359  
 3rd Qu.:1684.8   3rd Qu.:1.0000  
 Max.   :2659.0   Max.   :1.0000  
# Look at structure
str(sobj)
 'Surv' num [1:686, 1:2] 1814  2018   712  1807   772   448  2172+ 2161+  471  2014+ ...
 - attr(*, "dimnames")=List of 2
  ..$ : NULL
  ..$ : chr [1:2] "time" "status"
 - attr(*, "type")= chr "right"

The UnempDur dataset

The UnempDur dataset contains information on how long people stay unemployed. In this case, the event (finding a job) is something positive. This information is stored in the censor1 variable, which has a value of 1 if an individual was re-employed at a full-time job. The spell variable indicates the length of time an individual was unemployed in number of two-week intervals.

In this exercise, you’ll explore these censored values and create a Surv object, just as you did in the previous exercises with the GBSG2 dataset.

# Load the UnempDur data
data(UnempDur, package = "Ecdat")

# Count censored and uncensored data
cens_employ_ft <- table(UnempDur$censor1)
cens_employ_ft

   0    1 
2270 1073 
# Create barplot of censored and uncensored data
barplot(cens_employ_ft)

# Create Surv-Object
sobj <- Surv(UnempDur$spell, UnempDur$censor1)

# Look at 10 first elements
head(sobj, 10)
 [1]  5  13  21   3   9+ 11+  1+  3   7   5+

Estimation of survival curves

First Kaplan-Meier estimate

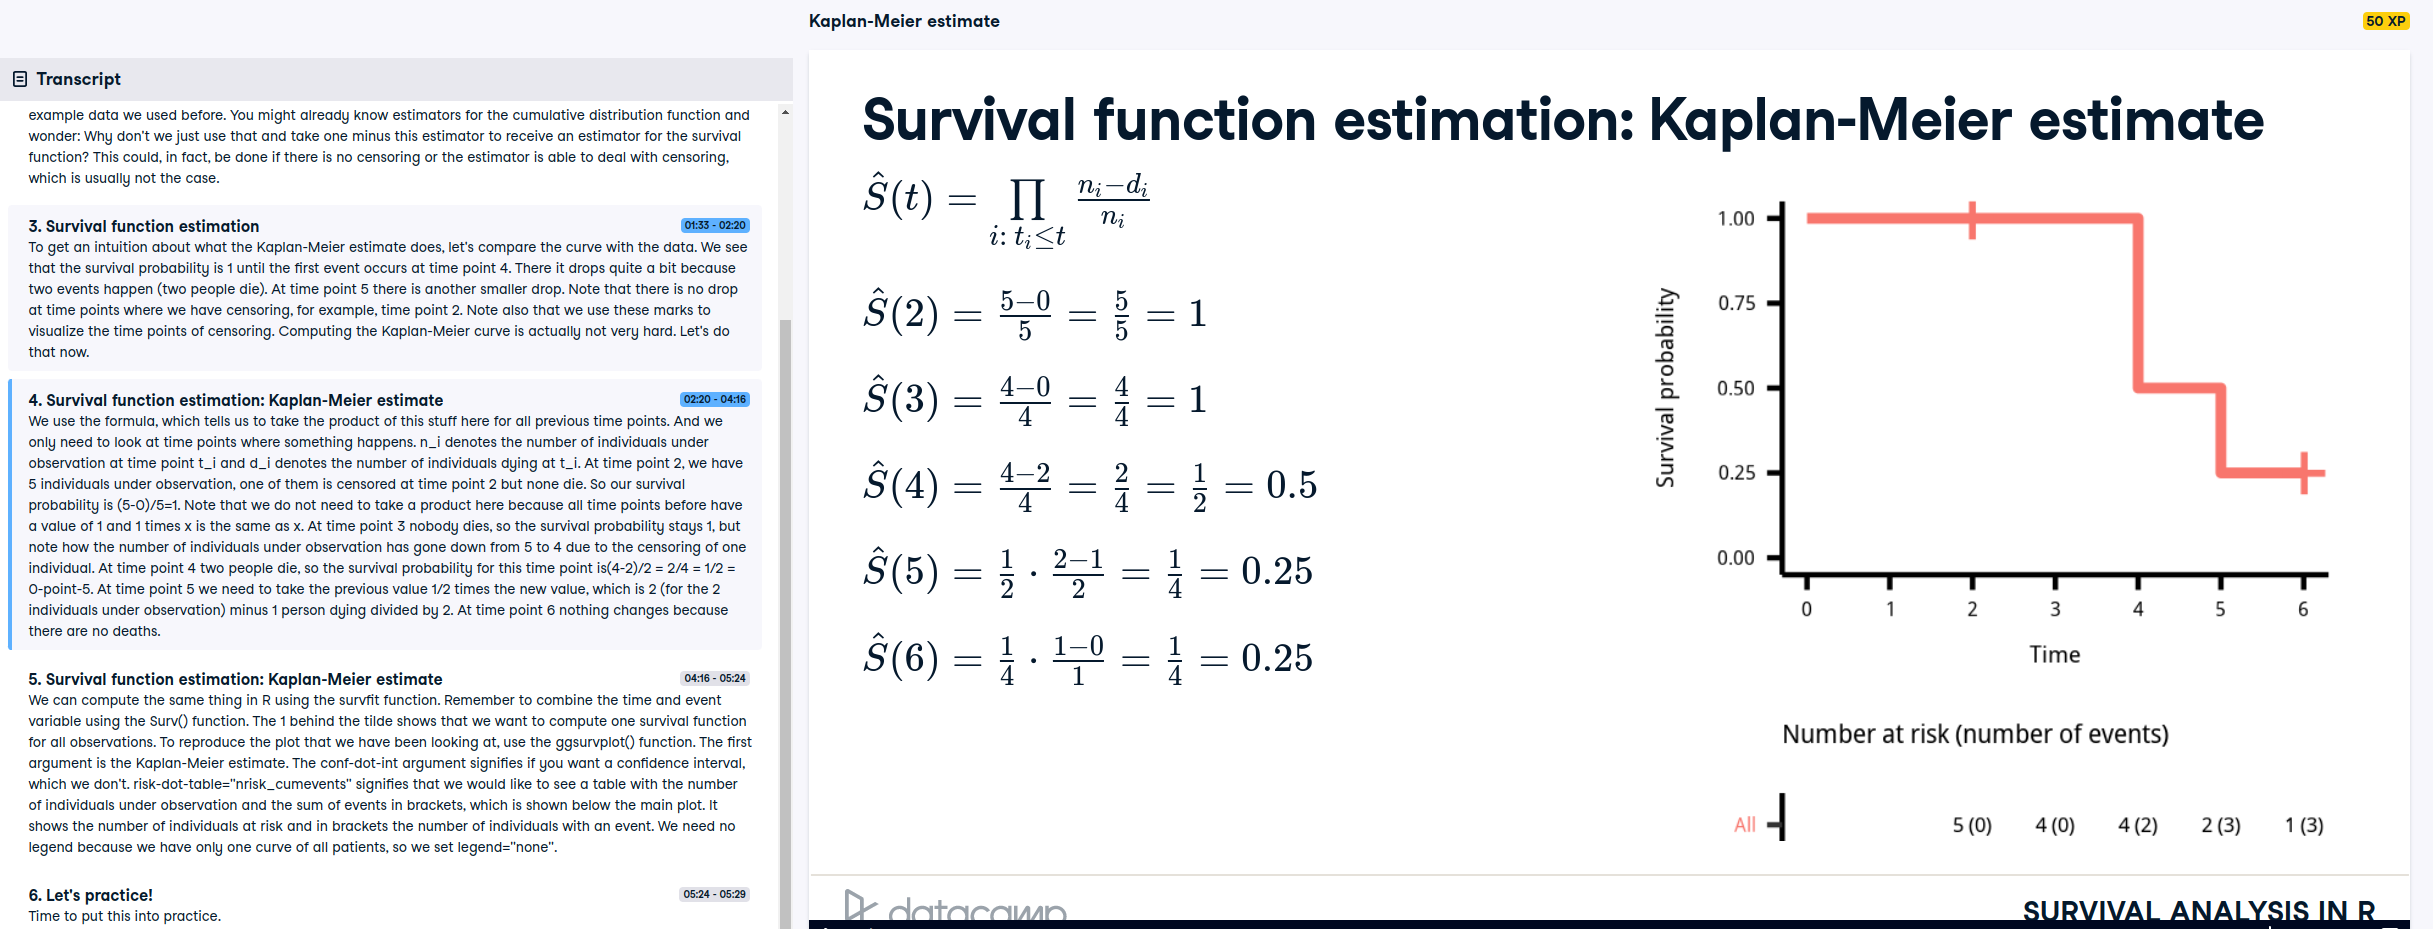
In this exercise, we will use the same data shown in the video. We will take a look at the survfit() function and the object it generates. This exercise will help you explore the survfit object.

Kaplan-Meier estimate Calculation

Kaplan-Meier estimate Calculation

The survival package is loaded for you in this exercise.

# Create time and event data
time <- c(5, 6, 2, 4, 4)
event <- c(1, 0, 0, 1, 1)

# Compute Kaplan-Meier estimate
km <- survfit(Surv(time, event) ~ 1)
km
Call: survfit(formula = Surv(time, event) ~ 1)

     n events median 0.95LCL 0.95UCL
[1,] 5      3    4.5       4      NA
# Take a look at the structure
str(km)
List of 16
 $ n        : int 5
 $ time     : num [1:4] 2 4 5 6
 $ n.risk   : num [1:4] 5 4 2 1
 $ n.event  : num [1:4] 0 2 1 0
 $ n.censor : num [1:4] 1 0 0 1
 $ surv     : num [1:4] 1 0.5 0.25 0.25
 $ std.err  : num [1:4] 0 0.5 0.866 0.866
 $ cumhaz   : num [1:4] 0 0.5 1 1
 $ std.chaz : num [1:4] 0 0.354 0.612 0.612
 $ type     : chr "right"
 $ logse    : logi TRUE
 $ conf.int : num 0.95
 $ conf.type: chr "log"
 $ lower    : num [1:4] 1 0.1877 0.0458 0.0458
 $ upper    : num [1:4] 1 1 1 1
 $ call     : language survfit(formula = Surv(time, event) ~ 1)
 - attr(*, "class")= chr "survfit"
# Create data.frame
data.frame(time = km$time, n.risk = km$n.risk, n.event = km$n.event,
           n.censor = km$n.censor, surv = km$surv) %>%
    data_table()

Exercise ignoring censoring

You throw a party and at 1 a.m. guests suddenly start dancing. You are curious to analyze how long your guests will dance for and start collecting data. The problem is that you get tired and go to bed after a while.

You obtain the following right censored dancing times data given in dancedat:

name is the name of your friend. time is the right-censored dancing time. obs_end indicates if you observed the end of your friends dance (1) or if you went to sleep before they stopped dancing (0). You start analyzing the data in the morning, but you are tired and, at first, ignore the fact that you have censored observations. Then you remember this course on DataCamp and do it correctly.

The survival package is loaded for you in this exercise.

# Create dancedat data
dancedat <- data.frame(
    name = c("Chris", "Martin", "Conny", "Desi", "Reni", "Phil", 
             "Flo", "Andrea", "Isaac", "Dayra", "Caspar"),
    time = c(20, 2, 14, 22, 3, 7, 4, 15, 25, 17, 12),
    obs_end = c(1, 1, 0, 1, 1, 1, 1, 1, 0, 0, 0))

# Estimate the survivor function pretending that all censored observations are actual observations.
km_wrong <- survfit(Surv(time) ~ 1, data = dancedat)

# Estimate the survivor function from this dataset via kaplan-meier.
km <- survfit(Surv(time, obs_end) ~ 1, data = dancedat)

# Plot the two and compare
ggsurvplot_combine(list(correct = km, 
                        wrong = km_wrong))

Estimating and visualizing a survival curve

Let’s take a look at the survival of breast cancer patients.

In this exercise, we work with the GBSG2 dataset again.

The survival and survminer packages and the GBSG2 data are loaded for you in this exercise.

# Kaplan-Meier estimate
km <- survfit(Surv(time, cens)~1, data = GBSG2)

# plot of the Kaplan-Meier estimate
ggsurvplot(km)

# add the risk table to plot
ggsurvplot(km, risk.table = TRUE)

# add a line showing the median survival time
ggsurvplot(km, risk.table = TRUE, surv.median.line = "hv")

Estimating median survival from a Weibull model

We can now estimate the survival of the breast cancer patients in the GBSG2 data using a Weibull model (function survreg()). Remember, the Weibull model estimates a smooth survival function instead of a step function, which is what the Kaplan-Meier method estimates.

The predict() function with type = “quantile” allows us to compute the quantiles of the distribution function. We will use this to compute the median survival.

The survival package and the GBSG2 data are loaded for you in this exercise.

  • Estimate a Weibull model for the breast cancer patients.
  • Compute the median survival from this model using the predict() function with type = “quantile”
# Weibull model
wb <- survreg(Surv(time, cens) ~ 1, data = GBSG2)

# Compute the median survival from the model
predict(wb, type = "quantile", p = 0.5, newdata = data.frame(1))
      1 
1693.93 

Survival curve quantiles from a Weibull model We can now estimate the survival of the breast cancer patients in the GBSG2 data using a Weibull model.

The predict() function with type = “quantile” allows us to compute the quantiles of the distribution function. As we learned in this course so far, the survival function is 1 - the distribution function ( S = 1 -D), so we can easily compute the quantiles of the survival function using the predict() function.

The survival package and GBSG2 data are loaded for you in this exercise.

  • Estimate a Weibull model for the breast cancer patients.
  • Get the time point at which the probability of surviving longer than that time point is 70 Percent (using the predict() function with type = “quantile”).
# Weibull model
wb <- survreg(Surv(time, cens) ~ 1, data = GBSG2)

# 70 Percent of patients survive beyond time point...
predict(wb, type = "quantile", p = 1-.7, newdata = data.frame(1))
       1 
1004.524 

Estimating the survival curve with survreg()

We can now estimate the survival of the breast cancer patients in the GBSG2 data using a Weibull model.

The Weibull distribution has two parameters, which determine the form of the survival curve.

The survival package and the GBSG2 data are loaded for you in this exercise.

  • Estimate a Weibull model for the breast cancer patients.
  • Compute the estimated survival curve from the model using the predict() function with type = “quantile”.
  • Create a data.frame with the time points and corresponding survival probabilities.
  • Look at the first few lines of the result using the function head().
# Weibull model
wb <- survreg(Surv(time, cens) ~ 1, GBSG2)

# Retrieve survival curve from model probabilities 
surv <- seq(.99, .01, by = -.01)

# Get time for each probability
t <- predict(wb, type = "quantile", p = 1 - surv, newdata = data.frame(1))

# Create data frame with the information
surv_wb <- data.frame(time = t, surv = surv)

# Look at first few lines of the result
head(surv_wb ) %>%
    data_table()

Comparing Weibull model and Kaplan-Meier estimate

Let’s plot the survival curve we get from the Weibull model for the GBSG2 data!

The survival and survminer packages and the GBSG2 data are loaded for you in this exercise.

  • Compute the Weibull model for the GBSG2 data.
  • Compute the survival curve from the model.
  • Plot the survival curves you get from the two estimates.
# Weibull model
wb <- survreg(Surv(time, cens) ~ 1, GBSG2)

# Retrieve survival curve from model
surv <- seq(.99, .01, by = -.01)

# Get time for each probability
t <- predict(wb, type = "quantile", p = 1-surv, newdata = data.frame(1))

# Create data frame with the information needed for ggsurvplot_df
surv_wb <- data.frame(time = t, 
                      surv = surv, 
                      upper = NA, 
                      lower = NA, 
                      std.err = NA)

# Plot
ggsurvplot_df(fit = surv_wb, 
              surv.geom = geom_line)

The Weibull model

Interpreting coefficients

We have a dataset of lung cancer patients. In this exercise, we want to know if the sex of the patients is associated with their survival time.

The survival package and the dataset are already loaded for you.

  • Use the survreg() function to estimate a Weibull model.
  • Women survive longer from
# Look at the data set
load("dat.rda")
str(dat)
'data.frame':   228 obs. of  3 variables:
 $ time  : num  306 455 1010 210 883 ...
 $ status: num  2 2 1 2 2 1 2 2 2 2 ...
 $ sex   : Factor w/ 2 levels "male","female": 1 1 1 1 1 1 2 2 1 1 ...
# Estimate a Weibull model
wbmod <- survreg(Surv(time, status) ~ sex, data = dat)
broom::tidy(wbmod) %>%
    data_table()

Compute Weibull model

For a Weibull model with covariates, we can compute the survival curve just as we did for the Weibull model without covariates. The only thing we need to do is specify the covariate values for a given survival curve in the predict() function. This can be done with the argument newdata.

  • Compute a Weibull model for the GBSG2 dataset with covariate horTh to analyze the effect of hormonal therapy on the survival of patients.
  • Compute the survival curve for patients who receive hormonal therapy.
  • Take a look at the survival curve with str().
# Weibull model
wbmod <- survreg(Surv(time, cens) ~ horTh, data = GBSG2)

# Retrieve survival curve from model
surv <- seq(.99, .01, by = -.01)
t_yes <- predict(wbmod, type = "quantile", p = 1 - surv,
                 newdata = data.frame(horTh = "yes"))

# Take a look at survival curve
str(t_yes)
 num [1:99] 76.4 131.4 180.9 227.2 271.4 ...

Computing a Weibull model and the survival curves In this exercise we will reproduce the example from the video using the following steps:

  • Compute Weibull model
  • Decide on “imaginary patients”
  • Compute survival curves
  • Create data.frame with survival curve information
  • Plot In this exercise, we will focus on the first three steps. The next exercise will cover the remaining steps.

The survival, survminer, and reshape2 packages and the GBSG2 data are loaded for you in this exercise.

  • Compute the Weibull model for the GBSG2 data with covariates horTh and tsize.
  • Decide on “imaginary patients”: the two levels of horTh and the 25%, 50%, and 75% quantiles of tsize.
# Weibull model
wbmod <- survreg(Surv(time, cens) ~horTh  + tsize, data = GBSG2)

# Imaginary patients
newdat <- expand.grid(
    horTh = levels(GBSG2$horTh),
    tsize = quantile(GBSG2$tsize, probs = c(.25, 0.5, 0.75)))
data_table(newdat)
# Compute survival curves
surv <- seq(.99, .01, by = -.01)
t <- predict(wbmod, type = "quantile", p = 1 - surv,
             newdata = newdat)

# How many rows and columns does t have?
dim(t)
[1]  6 99

Visualising a Weibull model

In this exercise we will reproduce the example from the video following the steps:

# Use cbind() to combine the information in newdat with t
surv_wbmod_wide <- cbind(newdat, t)

# Use melt() to bring the data.frame to long format
library(reshape2)
surv_wbmod <- melt(surv_wbmod_wide, 
                   id.vars = c("horTh", "tsize"), 
                   variable.name = "surv_id", 
                   value.name = "time")

# Use surv_wbmod$surv_id to add the correct survival probabilities surv
surv_wbmod$surv <- surv[as.numeric(surv_wbmod$surv_id)]

# Add columns upper, lower, std.err, and strata to the data.frame
surv_wbmod[, c("upper", "lower", "std.err", "strata")] <- NA

# Plot the survival curves
ggsurvplot_df(surv_wbmod, surv.geom = geom_line,
              linetype = "horTh", color = "tsize", legend.title = NULL)

Computing a Weibull and a log-normal model

In this exercise, we want to compute a Weibull model and a log-normal model for the GBSG2 data. You will see that the process of computing the survival curve is the same. In the upcoming exercise, we will compare the results from the two models and see the differences.

The survival, survminer, and reshape2 packages and the GBSG2 data are loaded for you in this exercise.

  • Compute the Weibull model

  • Compute the log-normal model

  • The Weibull distribution is the the default for survreg(). To compute a log-normal model you need to adjust the distribution argument.

  • Define the new dataset as a data.frame with the two levels of hormonal Therapy.

  • Use predict() to compute the survival functions.

# Weibull model
wbmod <- survreg(Surv(time, cens) ~ horTh, 
                 data = GBSG2)

# Log-Normal model
lnmod <- survreg(Surv(time, cens) ~ horTh, 
                 data = GBSG2, dist= "lognormal")

# Newdata
newdat <- data.frame(horTh = levels(GBSG2$horTh))

# Surv
surv <- seq(.99, .01, by = -.01)

# Survival curve from Weibull model and log-normal model
wbt <- predict(wbmod, type= "quantile", p = 1- surv, newdata = newdat)
lnt <- predict(lnmod, type = "quantile", p = 1 - surv, newdata = newdat)
surv_wide <- cbind(newdat, wbt) %>%
    mutate(dist = "weibull") %>%
    bind_rows(
        cbind(newdat, lnt) %>%
            mutate(dist = "lognormal")  
    )

Comparing Weibull and Log-Normal Model I

In this exercise, we want to add the correct survival probabilities to a data frame. This data frame will be used to plot the survival curves. surv_wide is a wide data frame containing hormonal therapy information and the survival curves for the Weibull and log-normal models.

# Melt the data.frame into long format.
surv_long <- melt(surv_wide, id.vars = c("horTh", "dist"), 
                  variable = "surv_id", value.name = "time")

# Add column for the survival probabilities
surv_long$surv <- surv[as.numeric(surv_long$surv_id)]

# Add columns upper, lower, std.err, and strata contianing NA values
surv_long[, c("upper", "lower", "std.err", "strata")] <- NA

Comparing Weibull and Log-Normal Model II

In this exercise, we want to compare the survival curves estimated by a Weibull model and by a log-normal model for the GBSG2 data. This exercise shows how the estimates change if you use a different distribution.

The survival, survminer, and reshape2 packages and the GBSG2 data are loaded for you in this exercise.

# Plot the survival curves
ggsurvplot_df(surv_long, surv.geom = geom_line,
              linetype ="horTh" , color = "dist", legend.title = NULL)

The Cox model

Computing a Cox model

We have a dataset of lung cancer patients. We want to know if their performance score (variable performance) is associated with their survival time. The performance score measures how well a patient can perform usual daily activities (bad=0, good=100).

The survival package and the dat dataset are already loaded for you.

  • Compute a Cox model for the lung cancer data dat using coxph() to estimate the effect of the performance score (variable performance) on the survival of lung cancer patients.
  • Use the coef() function to show the model coefficient.
# Compute Cox model
load("dat_cox.rda")
cxmod <- coxph(Surv(time, status) ~ performance, data = dat_cox)

# Show model coefficient
library(broom)
tidy(cxmod) %>% data_table()

Computing the survival curve from a Cox model

In this exercise, we will reproduce the example from the video following the steps:

Compute Cox model Decide on “imaginary patients” Compute survival curves Create data.frame with survival curve information Plot We will focus now on the first three steps in this exercise and do the next two steps in the upcoming exercise.

The survival and survminer packages and the GBSG2 data are loaded for you in this exercise.

  • Compute the Cox model for the GBSG2 data with covariates horTh and tsize.
  • Decide on “imaginary patients”: the two levels of horTh and the 25%, 50%, and 75% quantile.
  • Add rownames letters “a” - “f” to the imaginary patients data.frame.
# Cox model
cxmod <- coxph(Surv(time, cens) ~ horTh + tsize, data = GBSG2)

# Imaginary patients
newdat <- expand.grid(
  horTh = levels(GBSG2$horTh),
  tsize = quantile(GBSG2$tsize, probs = c(0.25, 0.5, 0.75)))

rownames(newdat) <- letters[1:6]

# Compute survival curves
cxsf <- survfit(cxmod, 
                data = GBSG2, 
                newdata = newdat, 
                conf.type = "none")

# Look at first 6 rows of cxsf$surv and time points
head(cxsf$surv)
     a b c d e f
[1,] 1 1 1 1 1 1
[2,] 1 1 1 1 1 1
[3,] 1 1 1 1 1 1
[4,] 1 1 1 1 1 1
[5,] 1 1 1 1 1 1
[6,] 1 1 1 1 1 1
head(cxsf$time)
[1]  8 15 16 17 18 29

Visualizing Cox

# Compute data.frame needed for plotting
surv_cxmod0 <- surv_summary(cxsf)

# Look at the first few lines
head(surv_cxmod0) %>% data_table()
# Get a character vector of patient letters (patient IDs)
pid <- as.character(surv_cxmod0$strata)

# Multiple of the rows in newdat so that it fits with surv_cxmod0
m_newdat <- newdat[pid, ]

# Add patient info to data.frame
surv_cxmod <- cbind(surv_cxmod0, m_newdat)
head(surv_cxmod) %>% data_table()

Plot

# Plot
ggsurvplot_df(surv_cxmod, linetype = "horTh", color = "tsize",
  legend.title = NULL, censor = FALSE)

Capstone: The Cox model

To conclude the course, let’s take a look back at the lung cancer dataset we utilized briefly in these last 2 chapters. To recap, this dataset contains information on the survival of patients with advanced lung cancer from the North Central Cancer Treatment Group. The event is stored in the status variable, which has a value of 2 if an individual did not survive. The performance score (variable performance) measures how well a patient can perform usual daily activities (bad=0, good=100), rated by a physician. We want to know the association between specific performance scores and survival time.

# Compute Cox model and survival curves
lung <-  dat_cox
cxmod <- coxph(Surv(time, status) ~ performance, data = lung)
new_lung <- data.frame(performance = c(60, 70, 80, 90))
cxsf <- survfit(cxmod, data = lung, newdata = new_lung, conf.type = "none")

# Use the summary of cxsf to take a vector of patient IDs
surv_cxmod0 <- surv_summary(cxsf)
pid <- as.character(surv_cxmod0$strata)

# Duplicate rows in newdat to fit with surv_cxmod0 and add them in
m_newdat <- new_lung[pid, , drop = FALSE]
surv_cxmod <- cbind(surv_cxmod0, m_newdat)

# Plot
ggsurvplot_df(surv_cxmod, 
              color = "performance", 
              legend.title = NULL,
              censor = FALSE)

Capstone: Comparing survival curves

We saw from the last exercise that performance scores do have an effect on the survival probability. Now, let’s take a look at the survival curve of all individuals using the Kaplan-Meier estimate and compare it to the curve of a Cox model that takes performance into account. Note that for Cox models, you can just enter the survfit() output into ggsurvplot() instead of creating the needed data frame yourself and plugging it into ggsurvplot_df().

# Compute Kaplan-Meier curve
km <- survfit(Surv(time, status) ~ 1, data = lung)

# Compute Cox model
cxmod <- coxph(Surv(time, status) ~ performance, 
               data = lung)

# Compute Cox model survival curves
new_lung <- data.frame(performance = c(60, 70, 80, 90))

cxsf <- survfit(cxmod, data = lung,
                newdata = new_lung, 
                conf.type = "none")

# Plot Kaplan-Meier curve
ggsurvplot(km, conf.int = FALSE)

# Plot Cox model survival curves
ggsurvplot(cxsf, censor = FALSE)